Statistics is the science of collecting, analyzing, interpreting or explaining, and presenting data.
It can be employed to make an accurate decision.
- Collecting Data
- Definition of data and datum
- Datum : facts needed
- Data : collection of several datum
- Definition of population and sample
- Population : all subjects being studied
- Sample : part of population being studied
- Type of data
- Quantitative data : data in form of numbers
- Discrete data : data obtained by counting
- Continu data : data obtained by measuring
- Qualitative data : data not in form of number
- Methods in data collecting
- Interview
- Questionaire
- Observation
- Measures of Central Tendency
- Mean : the "average" you're used to, where you add up all the numbers and then divide by the number of numbers.
- formula :

- , represents the summationX, represents scoresN, represents number of scores
- Combined Mean :
- formula :

- Median : the "middle" value in the list of numbers. To find the median, your numbers have to be listed in numerical order, so you may have to rewrite your list first.
- formula :

- Mode : value that occurs most often. If no number is repeated, then there is no mode for the list.
- Measures of Dispersion
- Range : the difference between the largest and smallest values
- formula : R = biggest datum - smallest datum
- Quartile (Q1, Q2, Q3)
- Q1 : middle number between the smallest number and the median of the data set
- Q2 : median of the data
- Q3 : the middle value between the median and the highest value of the data set
- formula (total number of the numbers(n) is an even number) :

- formula (total number of numbers(n) is an odd number) :

- Interquartile Range : measure of variability, based on dividing a data set into quartiles
- formula : QR : Q3 - Q1
- Semi Interquartile Range / Quartile Deviation : measure of spread or dispersion. It is computed as one half the difference between the 75th percentile [often called (Q3)] and the 25th percentile (Q1)
- formula :

- Presenting Statistical Data
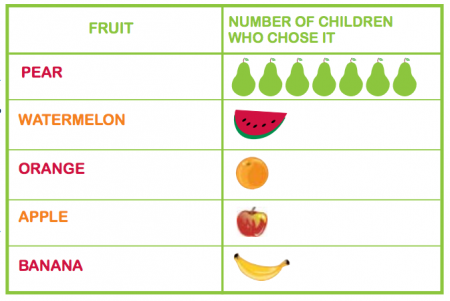
- Pictogram (pictorial graph)
- Bar Chart

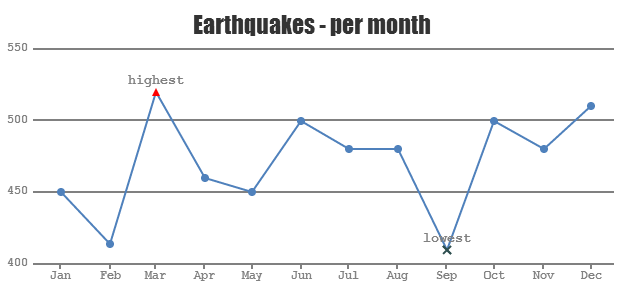
- Line Chart
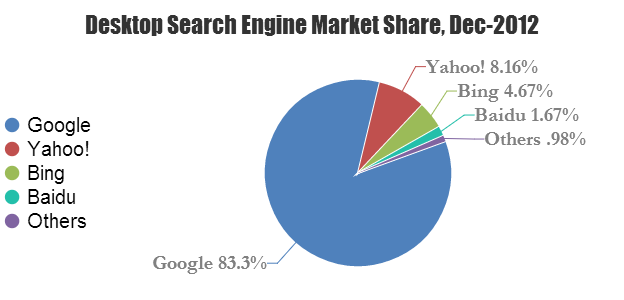
- Pie Chart